YachtWorld study shows impact of boat shows on web traffic
While it varies from show to show, web searches around boats increases greatly in markets holding boat shows, according to a new study from YachtWorld.
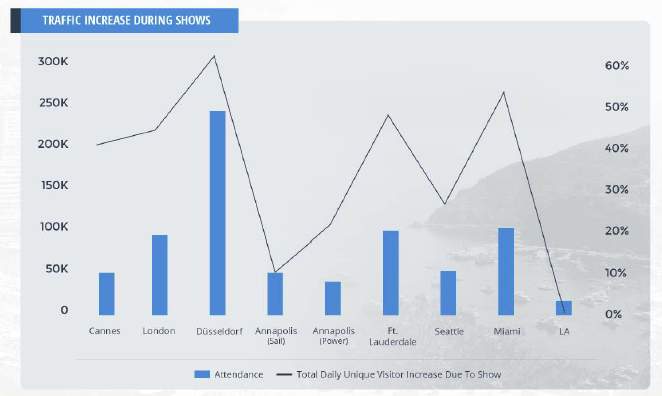
YachtWorld studied traffic to its sites, as well as general Google searches, around eight major boat shows to see how unique visitor traffic increased or decreased:
- Boot Dusseldorf, January 23-31, 2015
- Cannes, September 8-13, 2015
- Annapolis, October 8-12/15-18, 2015
- Fort Lauderdale, November 5-9, 2015
- London, January 6-15, 2016
- Seattle, January 29-February 6, 2016
- Yachts Miami Beach, February 11-15, 2016
- Los Angeles, February 25-29, 2016
The results show the importance of targeting online advertising to key show dates, said Katy Judge, YachtWorld brand manager.
If dealers and brokers “focus on certain dates of the show, it’s easy to forget about the overall lift you can get from having an online presence both before and after,” she said. “Looking at YachtWorld traffic and and Google trends, consumers are really starting to think about the show much further ahead than just the weekend before.”
On average, Google trends start going up for a show about four months ahead of time, Judge said.
That higher traffic, on average, continues immediately after the show as well for at least a couple weeks, showing the importance of immediate follow-up and targeted marketing post show.
“Our boat show survey in 2012 found that 70 percent of people said that when they got home from the show they went home and looked up the same boats online,” Judge said. “It’s not as long a trend as before the show … but that is a critical couple weeks where people are making decisions that they started to consider at the show.”
The different shows studied did show various trends as it relates to traffic. Here is a more detailed look from the YachtWorld team on each show.
Boot Dusseldorf, January 23-31, 2015
In a typical week, YachtWorld traffic in this region is highest on Sunday, then declines each day until Thursday, which has only around 73 percent of the traffic seen on the prior Sunday, before beginning to increase again each day to the following Sunday peak. A similar pattern continued during the show, although at elevated traffic levels.
Normal traffic trends would have resulted in average daily unique visitor counts of around 621 during the time the show ran, but because of increased interest as a result of the show, they jumped to 977 average daily unique visitors. Traffic peaked on the second day of the show, a Saturday.
Google Trends indicate advertising should begin in October, three months before the show.
Cannes, September 8-13, 2015
Normal traffic trends would have resulted in average daily unique visitor counts to YachtWorld of about 448 during the time the show ran, but because of increased interest as a result of the show, it jumped to 625 average daily unique visitors.
Traffic climbed throughout the show peaking on the final day, a Sunday. Google Trends for the show increased search beginning in July, two months before the show.
Annapolis, October 8-12/15-18, 2015
For the area, in a typical week, traffic is highest on Sunday and Monday and then drops each day to Friday, which has around 79 percent of the traffic seen on the prior Monday, before inching upward again on Saturday toward the following peak. This pattern persisted during both the sail and power shows, although it spiked up on the Fridays of both shows, as well as the weekend of the powerboat show.
Normal traffic trends would have resulted in average daily unique visitor counts around 998 during the time the sailboat show ran, and 946 during the time the powerboat show ran, but traffic improved to 1,093 and 1,204 average daily unique visitors.
Traffic peaked on the final days of each show, although was highest on the final three days (Friday-Sunday) of the power boat show. Google Trends indicate advertising should start in August, two months before the show.
Fort Lauderdale, November 5-9, 2015
During the week of the show, YachtWorld traffic increased each day of the show, peaking on Tuesday, November 10, the day after the show ended. Normal traffic trends would have resulted in average daily unique visitor counts of around 1,575 during the time the show ran, but increased to 2,222 average daily unique visitors.
Google Trends indicate advertising should start in August, three months before the show.
London, January 6-15, 2016
In a typical week, YachtWorld traffic in this region is highest on Monday, then drops each day until Saturday. During the show, traffic increased each day from the start of the show until the middle of the show, peaking on Sunday, January 10, before declining again and resuming usual seasonal patterns
Normal traffic trends result in average daily unique visitor counts of around 374 during the show, but increased to 498 average daily unique visitors during the show.
Google Trends indicate advertising should start in October, three months before the show.
Seattle, January 29-February 6, 2016
In a typical week, YachtWorld traffic in the region is highest on Monday, then drops each day to Friday. The usual traffic pattern persisted during the show, although at a higher volume.
Normal traffic trends result in average daily unique visitor counts of around 2,118, but increased to 2,729 average daily unique visitors during the show.
Google Trends indicate advertising should start in November, three months before the show.
Yachts Miami Beach, February 11-15, 2016
Held concurrently with the Miami International Boat Show, Yachts Miami Beach produced one of the biggest boosts in traffic.
Normal traffic trends would have resulted in average daily unique visitor counts of around 2,005 during the time the show ran, but increased to 2,984 average daily unique visitors during the show. Traffic peaked on the final two days of the show (Sunday and Monday).
Google Trends indicate advertising should start in November, three months before the show.
Los Angeles, February 25-29, 2016
Of the shows studied, the Los Angeles show seems to have had the smallest impact on Web traffic.
Normal traffic trends would have resulted in average daily unique visitor counts of around 2,276 during the time the show ran, but increased to 2,450 average daily unique visitors during the show.
Google Trends indicate advertising should start in December, two months before the show.


At Distinct (www.marketdistinctly.com) we’ve seen very similar results, and more specifically video views for boats peak during boat shows. Put simply: as beautiful and polished as a boat can be at the show, customers want to see it in action so they can experience the lifestyle that boat will deliver. It’s one reason we keep innovating with our Digital Displays: dealers who utilize them at boat shows are selling that lifestyle, rather than just the product (making for a much easier sell).